
UAE Trade Nears 3 Trillion Dirhams in the Era of Hormuz: Who Made the Record?
Summary
A record figure approaching 3 trillion dirhams... but who drove it? The article breaks down UAE trade in the era of Hormuz, the role of imports, gold, and re-exports, and what the figures hide regarding local production.
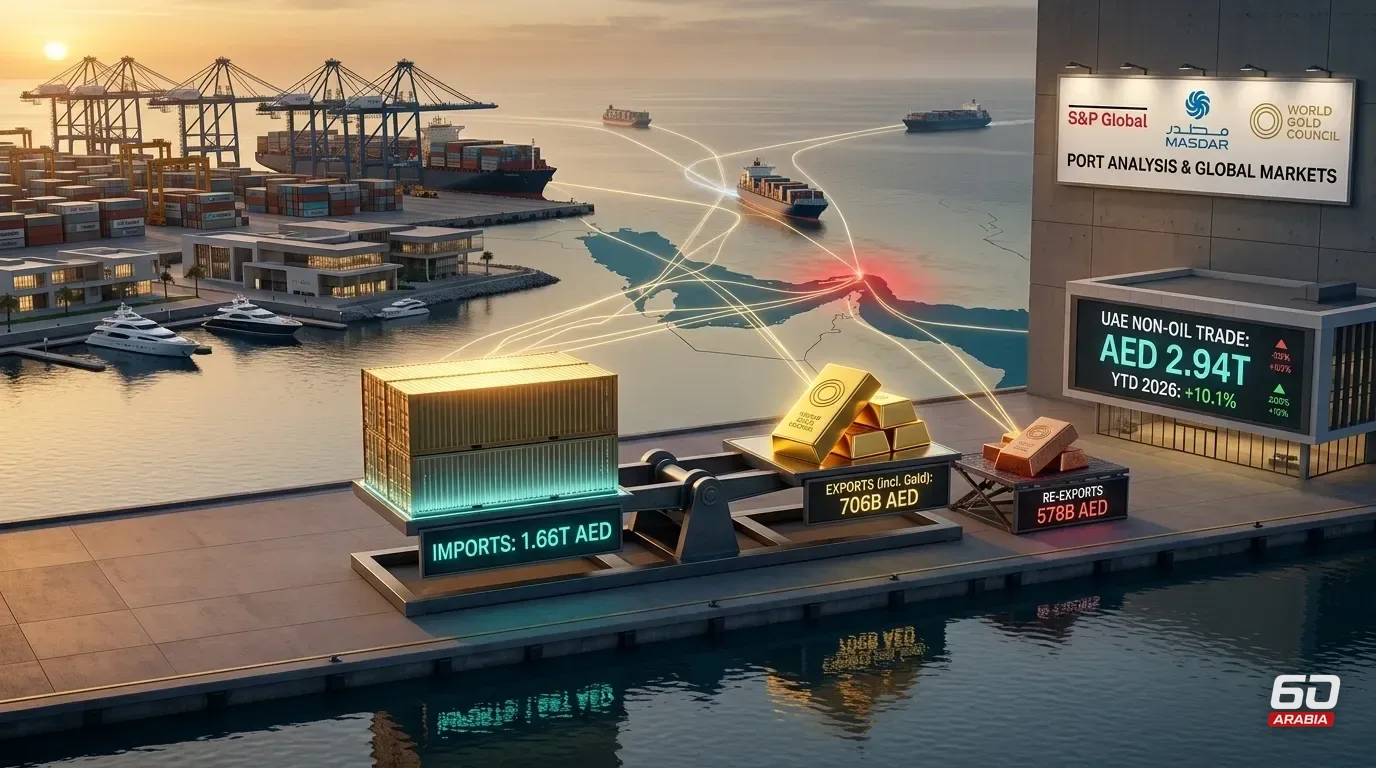
On Sunday, November 8, the UAE announced that its non-oil foreign trade reached AED 2.945 trillion in the first nine months of 2026, growing by 10.1% over the same period in 2025, approaching the 3-trillion barrier for the first time. The figure comes in a year when war broke out with Iran in late February, witnessing a near-total closure of the Strait of Hormuz from March and an unstable partial reopening in June.
The figure is accurate according to the Ministry of Foreign Trade data, but breaking it down indicates that the source of growth differs from what the headline suggests. The numbers indicate that the increase mostly came from imports and exports dominated by high-value, easily transportable goods such as gold, jewelry, and phones. Derived calculations suggest a potential decline in re-exports, the traditional pillar of the UAE's trade role, without the statement announcing its growth rate. The following is a test of this reading, not a final judgment, and every derived figure is labeled as a mathematical estimate.
This type of growth recalls what economist Joseph Stiglitz, 2001 Nobel laureate, wrote in an article published by Foreign Policy on April 15, 2020, about the lessons of the pandemic. He said the world searched for the cheapest producer for every link in supply chains, building a system that seemed efficient, but built, in his words, "a system that is plainly not resilient, not sufficiently diversified, and vulnerable to disruptions" (our translation). The question posed by today's numbers is: Does UAE trade, while growing in value, truly stand on firmer ground, or does it carry the same fragility on a larger scale?
What Actually Grew
Trade was distributed between imports worth AED 1.661 trillion (56% of total), non-oil exports worth AED 705.8 billion (24%), and re-exports worth AED 578 billion (approx. 20%). The ministry announced import growth of 11.5% and export growth of 21.6%, while not announcing the re-export growth.
The missing figure can be deduced. Dividing each value by one plus its growth rate yields values for the first nine months of 2025 of approximately AED 580 billion for exports, around AED 1,490 billion for imports, and around AED 2,675 billion for total trade. Re-exports are left at around AED 605 billion, making the current figure about 4% lower (mathematical estimate). Rounding the declared percentages to one decimal place does not change the sign of the result, as the maximum error resulting from it is a few billion compared to a calculated decline of nearly 27 billion. However, the figure is not official and requires confirmation from the ministry.
According to the calculation derived from the published percentages, total trade increased by about AED 270 billion, with the estimated increase in imports representing about 171 billion (63%) of it, and exports about 125 billion, after deducting about 27 billion from re-exports. This is a share of the calculated increase in trade value, and does not necessarily mean a share in local value added—which is what remains within the economy from manufacturing, wages, warehousing, handling, financing, and services. Furthermore, the label "non-oil" does not mean the goods are locally manufactured: gold, phones, and diamonds top the lists, and among the prominent imports are refined petroleum oils, whose value and growth were not published.
Slowdown and a Gap Requiring Explanation
Non-oil trade reached AED 997.1 billion in Q1, then AED 922.9 billion in Q2 (a drop of 7.4%), and AED 1.025 trillion in Q3. However, annual growth in Q3 reached only 7.1%, compared to about 12% for H1 (mathematical estimate), and 13.1% previously announced by the ministry for H1 in September. Export growth slowed from around 23% in H1 (mathematical estimate) to 19% in Q3, while remaining record-breaking, exceeding AED 100 billion in a single month for the first time in September.
There is a gap worth questioning. H1 was announced in September at 1.94 trillion, while the sum of Q1 and Q2 in today's report is 1.920 trillion. A discrepancy of around AED 17 billion has no explanation in available publications, and it is improper to assume it is a routine revision before the issuing authority states so.
Semi-Disabled Ports and Trade Resilient in Value
Here lies the puzzle. According to Alphaliner, handling at Jebel Ali dropped 23% year-on-year in Q1, then by over 90% in Q2 to 374,000 TEUs. Thus, its H1 handling did not exceed 3.14 million TEUs compared to 7.77 million a year earlier, down about 60%. Semafor reported on September 2 that observed transits through the strait dropped to a handful per day from around 90 before the war. In October, transits rose to their highest level since July according to S&P Global, despite ongoing attacks on vessels.
In the very same Q2, during which Jebel Ali handling dropped 86% from Q1, trade value declined by only 7.4%. That is, container volume and monetary value moved in diverging directions. Three hypotheses compete to explain this, none of which published figures can decisively resolve.
First, that shipments shifted to Fujairah and Khorfakkan and then overland: DP World stated it moved about 500,000 TEUs via road and rail corridors since March, averaging around 3,000 truck movements daily. An official told Semafor that overland transport from Fujairah or Khorfakkan could cost four to five times sailing through Hormuz to Jebel Ali.
Second, that growth is concentrated in goods that do not require containers. Third, that prices drove up value without an increase in physical volume.
Cost has a well-known trajectory: when freight rates, insurance premiums, and waiting times rise, they pass into input and product prices or are absorbed by corporate margins. One documented example is an Emirati beverage company that told AGBI in March it rerouted all shipments passing through the strait via India, Oman, Khorfakkan, Jeddah, and Dammam, resulting in longer delivery times. A single example cannot be generalized, but it illustrates the mechanism.
As for Sultan Al Jaber, Minister of Industry and Advanced Technology and CEO of ADNOC, he stated at the opening of ADIPEC on November 2 that shipping and logistics were less than 5% of barrel cost before the disruptions and today exceed 30%. The figure pertains to oil and its source is a player in the oil market, so it cannot be generalized to all trade, but it provides a gauge of the shock magnitude in delivery costs.
Gold and Goods That Travel Easily
Gold, phones, jewelry, and ornaments top the list of traded commodities. Gold leads exports and is also at the forefront of imports, meaning part of it flows in and out. Switzerland and Hong Kong, major gold trading hubs, were the top recipient markets for exports, growing by 75.8% and 59.1% respectively.
The value of the top ten commodities reached AED 2.011 trillion, representing 68% of the total, with a growth of 22.1% compared to 10.1% for total trade. If the comparison holds for the same goods, the remaining goods, valued at around AED 934 billion, contracted by nearly 9% from about 1,028 billion a year ago (mathematical estimate).
The rise in gold prices may be one factor. The average gold price in London reached $4,262 per ounce in Q3, up 23% from the previous year according to the World Gold Council, while the Q1 average was around $4,873 compared to about $2,860 in Q1 2025, an increase of about 70%. The slowdown in price increases from 70% to 23% coincides with the slowdown in trade growth—a correlation that does not prove causation. Gold's share in trade remains unannounced, and its contribution to export growth is unknown.
Goods such as gold, diamonds, and phones have an advantage during turbulent times: shipping costs represent a small fraction of their value, allowing them to absorb air freight and longer routes, whereas a container of factory inputs bears the full cost. This is a hypothesis, and what would test it is the distribution of trade by mode of transport, which is unpublished.
Agreements: Are They the Driver?
Minister of Foreign Trade Thani Al Zeyoudi stated that Comprehensive Economic Partnership Agreements (CEPAs) play a pivotal role in driving trade expansion. Non-oil trade with the 23 countries with which 19 agreements entered into force up to October 20 reached AED 510.8 billion, growing 6.6% over the same period in 2024 and 25.5% over 2023. In the same statement, total non-oil trade grew 37.2% over 2024 and 55.2% over 2023. On a 2024 basis, trade with agreement partners grew at less than one-fifth the pace of total trade, while trade with remaining countries grew by nearly 46%.
Published figures do not support the claim that agreements were the primary driver of growth during the period, though they do not rule out their impact given differing entry-into-force dates. The composition of this trade points in the same direction: imports of AED 317.6 billion (62%), re-exports of 104.6 billion (20.5%), and exports of 88.5 billion (17%). That is, exports to the 23 partners equal about 12.5% of total UAE non-oil exports.
Regarding diversification, the ministry pointed to trade growth with the rest of the world at 11.9% versus 8.3% with the top ten partners. However, exports to the top ten partners grew by 31.6%, faster than the 21.6% for total exports, indicating that export growth was relatively concentrated within this group, while published data alone is insufficient to judge changes in geographic diversification.

Ibrahim Gamal Ibrahim is an Egyptian journalist and expert in digital media, economic and financial journalism, with more than 20 years of experience across the Middle East and North Africa (MENA) markets. He specializes in leading editorial teams, developing content and digital growth strategies, and integrating artificial intelligence into newsrooms, with extensive experience covering financial markets, monetary policy, and the banking sector. He has held editorial positions at Argaam, Veto, Besraha, Al Mal, and Mubasher.
Profile and all their articlesBeyond The Number

14 سهماً بتركيز خمسة: ماذا يشتري المستثمر في صندوق التوزيعات السعودي؟

المدفوعات الإلكترونية في الإمارات: من يحاسب «Aani» على ما لا تقوله أرقامها؟

المركزي المصري يوسّع خدمة الوكلاء المصرفيين.. فمن يحمي العميل من خطأ الوكيل؟
أرامكو تربح 380.6 مليار ريال في 9 أشهر.. فلماذا لا يلاحق النقد سخاء التوزيعات؟
Weekly Newsletter
Read between the lines before everyone else. Decode the most important economic, tech, and decision-maker movements in the region.. in 5 minutes every Saturday.