
Who Filled the Void When Gulf Oil Stopped?
Summary
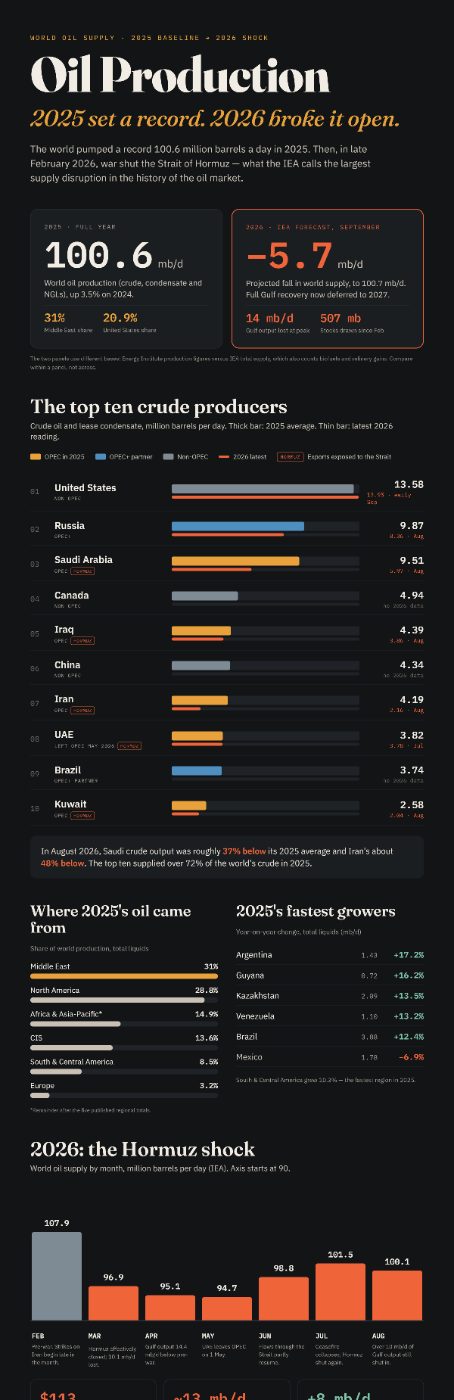
In 2025, the world pumped a record 100.6 million barrels per day. Then Hormuz was closed. Saudi production dropped by 37% and Iranian by 48%.. So who is pumping today?
Two numbers summarize what happened to oil in eighteen months.
First: 100.6 million barrels per day, which is what the world pumped in 2025, an increase of 3.5% over the previous year. A record high in the history of the industry.
Second: minus 5.7 million barrels per day, the decline expected by the International Energy Agency for 2026 supplies, dropping to 100.7 million barrels per day, with full Gulf recovery delayed until 2027.
Between the two figures lies a single event: the closure of the Strait of Hormuz in late February, which the agency describes as the largest supply disruption in the history of the oil market.
However, the most important story is not the scale of the loss, but its distribution. The world did not stop pumping; rather, who was pumping changed.
Who Lost?
Monthly figures for August reveal the depth of the blow. Saudi Arabia produced 5.97 million barrels per day, down from 8.24 in July, approximately 37% below its 2025 average of 9.51. Iran fell to 2.16 compared to an average of 4.19, representing a drop of nearly 48%. Meanwhile, Iraq declined to 3.86 from 4.39, and Kuwait to 2.04 from 2.58.
Even Russia, which is outside the Hormuz sphere, recorded 8.36 in August compared to an average of 9.87 in 2025.
In August, more than 10 million barrels per day of Gulf production remained offline. At the peak of the crisis, losses reached around 14 million barrels per day.
Who Gained?
The answer in one line: the Atlantic.
The United States recorded 13.95 million barrels per day of crude in early September, above its 2025 average of 13.58. When including all liquids, its production reached 21.1 million barrels per day in 2025, which nearly matches the combined production of Saudi Arabia and Russia.
The fastest-growing in 2025 was none of OPEC's major producers. Argentina grew by 17.2%, Guyana by 16.2%, Kazakhstan by 13.5%, and Brazil by 12.4%. Meanwhile, South and Central America was the fastest-growing region at 10.3%.
These are not merely statistical details. They represent a redistribution of the power to influence prices.
OPEC Loses a Member at the Worst Possible Time
On April 28, the UAE announced its withdrawal from OPEC and OPEC+ effective May 1, after 59 years of membership. The Emirates News Agency stated that the decision reflects a long-term economic vision and an acceleration of investment in domestic production, while Energy Minister Mazrouei confirmed it was a unilateral decision in which Saudi Arabia did not participate.
The background is well known: an extended dispute over the UAE's 3.5 million barrels per day quota, against investments of about $150 billion aimed at a production capacity of 5 million barrels per day by 2027.
This means OPEC is losing one of its largest and lowest-cost producers, while its remaining members are shut down by force rather than choice. The organization that derives its strength from managing surplus now finds itself managing a deficit it did not choose.
Monthly Trajectory: The Drop and the Plateau
The monthly global supply trajectory tells the story clearly: February before the war at 107.9 million barrels per day, then 96.9 in March with the actual closure of the strait, 95.1 in April when Gulf production fell 14.4 million barrels below its pre-war level, and the bottom at 94.7 in May.
After that, a partial recovery began: 98.8 in June with the partial resumption of flows, 101.5 in July, and then 100.1 in August following the collapse of the truce and the re-closure of Hormuz.
The shape drawn by this curve is neither a V-shape nor a U-shape. It is a plateau at a lower level, and the market has learned to live on it.
What Does This Mean for Arab Economies?
For producers: High prices do not compensate for unsold barrels. When you lose a third of your production, a rise in Brent prices is not enough to bridge the budget deficit, especially with additional transport costs, insurance premiums, and freight charges.
For importers: The bill increases twice—once through higher prices and once through the cost of longer routes.
And the coming risk is completely opposite. The International Energy Agency expects production to rebound by about 8 million barrels per day in 2027. In the meantime, non-Gulf producers have not stopped expanding. If Gulf barrels return to a market already flooded with alternatives, the problem will not be a shortage, but a surplus.
NovaTAQA



Weekly Newsletter
Read between the lines before everyone else. Decode the most important economic, tech, and decision-maker movements in the region.. in 5 minutes every Saturday.